I will start by explaining some basic concepts, and then I will try to illustrate them with a practical use case.
Basic Concepts
Data warehouse
A data warehouse is where data is stored for analytical purposes.
You would typically build a pipeline that extract data from relevant sources, which is then transformed and loaded into the warehouse.
Fact Table
A facts table stores the business process measurements.
Example:
- Each item scanned at the point of sale as part of a customer’s shopping basket could be stored as a row in the facts table.
- Each new user registration could be stored as a row.
- One row for each bank account transaction.
Dimension Table
A dimension table provide textual descriptive information about a business process measurement.
For example we could use a date dimension to filter the facts on a particular date; Additionally we could use other dimensions to answer question like who, what, where, how related to the facts.
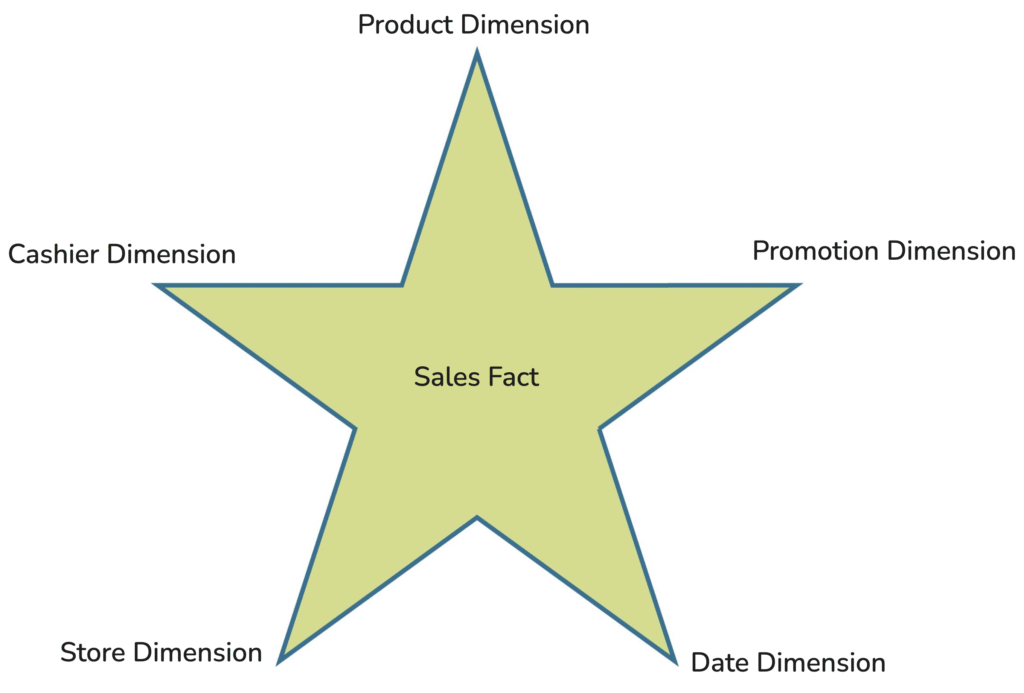
Star schema
Draw a star shape, put a facts table at the center and the dimensions tables on the edges. You have a star schema :). The dimension tables serve the fact table so the should be design to be relevant to it.
Normalisation
Let’s imagine a product table with a ‘category’ column. Many products will end up in the same category, creating duplicate data. This means that if a category’s name changes, all the rows containing it must be updated in order to be consistent, which is error-prone.
To avoid this we could normalise by creating a new category table replacing the category name in the product table by the category’s ID. Therefore changing a category’s name is done in one place.
Although normalisation creates many small tables that makes it easier to update the data consistently, it requires a join between the product and category tables, to access category name alongside the product, which impacts the performance at scale.
Retail sales business classical use case
Let’s illustrate these concept by doing a simple modelling exercise for retail sales.
We will answer following questions and deduce a simple model.
Investigation
What is the business process?
A customer enter in the grocery store, put some items in his shopping basket and head up to the point of sale.
A cashier scan each item, compute the total price and gently ask the customer to pay. The customer pays, say thank you and that marks the end of the sales transaction.
Let’s assume that the scanned items data are stored in a database that we will then use as our source of data for the data warehouse.
What does the facts table rows represent (called Grain)?
Each row represents one item scanned during a sales transaction.
For example, a customer could come to the point of sale with a banana and an orange in their basket. We would insert one row for the banana and another for the orange.
Let’s say that a customer heads up to the point of sale with a banana and an orange in his cart. We will insert a row for the banana and another one for the orange.
What are the dimensions?
The “why, who, what, when, how, where” questions are useful for finding out the grain’s dimensions.
What is being sold? -> Product Dimension
Who handled the sale? -> Cashier Dimension
Where did the sale take place? -> Store Dimension
When did the sale happen? -> Date Dimension
Why did the customer choose this item? -> Promotion Dimension
etc…
What are the facts?
To find the facts, we need to answer to the question “What is the process measuring?”.
In our case, each scanned item stores informations about the quantity and the dollar cost.
Design proposition
We could deduce the following star schema by answering the previous questions. The facts table is at the centre of the star, surrounded by dimensions tables. These dimensions tables are used to filter, constrain or label the facts, as well as to explain or describe them.
Looking at the facts table columns in detail, we could see that there is a foreign key for each dimension table, as illustrated in the schema below.
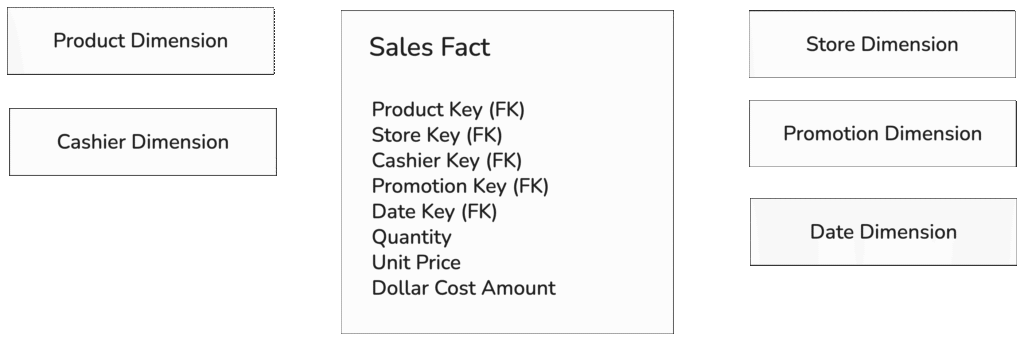
Let’s say you want to know the total dollar cost of vegetables sold last weekend.
You would filter on the date and product dimension and aggregation would be performed on the ‘dollar cost amount’ column in the ‘sales fact‘ table.
Conclusion
Designing a dimensional model is an iterative exercise.
- Talk to the end users to understand their needs
- Challenge the current design against new evidence or requirements.
- Instead of prematurely aggregating your dimensions, favour atomic values.
- Avoid normalisation wherever possible, since it can reduce the query performance and increase complexity. We want the opposite.
Resources
I would recommends reading the book The Data Warehouse Toolkit by Kimball to find out more.
Leave a Reply